"""
Understanding GIS: Practical 7
@author jonnyhuck
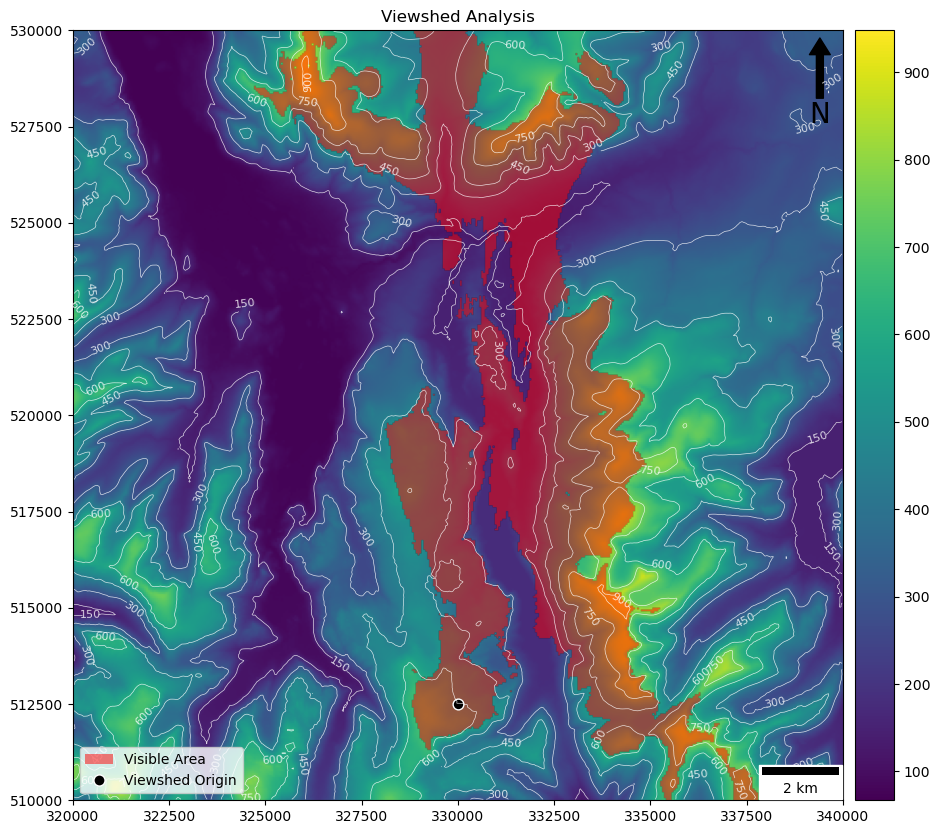
Calculate a Viewshed using Bresenham's Line and Midpoint Circle Algorithm
Note that parallelising the LoS makes it slower as the overhead is greater than the
References:
https://rasterio.readthedocs.io/en/latest/api/rasterio.plot.html
https://rasterio.readthedocs.io/en/stable/topics/plotting.html
https://matplotlib.org/3.1.1/gallery/color/colormap_reference.html
https://matplotlib.org/stable/gallery/text_labels_and_annotations/custom_legends.html
http://webhelp.esri.com/arcgisdesktop/9.3/index.cfm?TopicName=How%20Visibility%20works
https://www.zoran-cuckovic.from.hr/QGIS-visibility-analysis/help_qgis2.html#algorithm-options
https://matplotlib.org/api/_as_gen/matplotlib.axes.Axes.contour.html#matplotlib.axes.Axes.contour
New Topics:
break
pass
"""
from sys import exit
from time import perf_counter
from geopandas import GeoSeries
from shapely.geometry import Point
from math import hypot, floor, ceil
from matplotlib.lines import Line2D
from matplotlib.patches import Patch
from rasterio.transform import rowcol
from rasterio import open as rio_open
from numpy import zeros, column_stack
from matplotlib.colors import Normalize
from matplotlib.cm import ScalarMappable
from rasterio.plot import show as rio_show
from skimage.draw import line, circle_perimeter
from matplotlib.pyplot import subplots, savefig
from matplotlib_scalebar.scalebar import ScaleBar
from matplotlib.colors import LinearSegmentedColormap
def coord_2_img(transform, x, y):
"""
* Convert from coordinate space to image space
"""
r, c = rowcol(transform, x, y)
return int(r), int(c)
def adjust_height(height, distance, earth_diameter=12740000, refraction_coefficient=0.13):
"""
* Adjust the apparant height of an object at a certain distance, accounting for the
* curvature of the earth and atmospheric refraction
*
* This is the Arc GIS version of the calculation for atmospheric refraction:
* a = distance**2 / earth_diameter
* return height - a + refraction_coefficient * a
"""
# this is the QGIS version of the calculation for atmospheric refraction
return height - (distance**2 / earth_diameter) * (1 - refraction_coefficient)
def line_of_sight(r0, c0, height0, r1, c1, height1, radius, dem_data, transform, output):
"""
* Use Bresenham's Line algorithm to calculate a line of sight from one point to another point,
* returning a list of visible cells
"""
# init variable for biggest dydx so far (starts at -infinity)
max_dydx = -float('inf')
# loop along the pixels in the line (exclusing the first one)
for r, c in column_stack(line(r0, c0, r1, c1))[1:]:
# calculate distance travelled so far (in pixels)
dx = hypot(c0 - c, r0 - r)
# if we go too far, or go off the edge of the data, stop looping
if dx > radius or not 0 <= r < dem_data.shape[0] or not 0 <= c < dem_data.shape[1]:
break
# calculate the current value for dy / dx without correction
# base_dydx = (dem_data[(r, c)] - height0) / dx
# tip_dydx = (dem_data[(r, c)] + height1 - height0) / dx
# calculate the current value for dy / dx with correction (a little bit more)
base_dydx = (adjust_height(dem_data[(r, c)], dx * transform[0]) - height0) / dx
tip_dydx = (adjust_height(dem_data[(r, c)] + height1, dx * transform[0]) - height0) / dx
# if the tip dydx is bigger than the previous max, it is visible
if tip_dydx > max_dydx:
output[(r, c)] = 1
# if the base dydx is bigger than the previous max, update
max_dydx = max(max_dydx, base_dydx)
# return updated output surface
return output
def viewshed(x0, y0, radius_m, observer_height, target_height, dem_data, transform):
"""
* Use Midpoint Circle algorithm to determine endpoints for viewshed
"""
# convert origin coordinates to image space
r0, c0 = coord_2_img(transform, x0, y0)
# make sure that we are within the dataset
if not 0 <= r0 < dem_data.shape[0] or not 0 <= c0 < dem_data.shape[1]:
print(f"Sorry, {x0, y0} is not within the elevation dataset.")
exit()
# convert the radius (m) to pixels
radius_px = int(radius_m / transform[0])
# get the observer height (above sea level)
height0 = dem_data[(r0, c0)] + observer_height
# create output array at the same dimensions as data for viewshed
output = zeros(dem_data.shape)
# set the start location as visible automatically
output[(r0, c0)] = 1
# get pixels in the perimeter of the viewshed
for r, c in column_stack(circle_perimeter(r0, c0, radius_px)):
# calculate line of sight to each pixel, pass output and get a new one back each time
output = line_of_sight(r0, c0, height0, r, c, target_height, radius_px, dem_data, transform, output)
# return the resulting viewshed
return output
# this block will only run if the script is executed directly
if __name__ == "__main__":
# open the elevation data file
with rio_open("../../data/helvellyn/Helvellyn-50.tif") as dem:
# read the data out of band 1 in the dataset
dem_data = dem.read(1)
# set origin for viewshed
x0, y0 = 330000, 512500
# calculate the viewshed
start = perf_counter()
output = viewshed(x0, y0, 20000, 1.8, 100, dem_data, dem.transform)
print(f"{perf_counter() - start:.2f}")
# output image
fig, my_ax = subplots(1, 1, figsize=(16, 10))
my_ax.set_title("Viewshed Analysis")
# draw dem
rio_show(
dem_data,
ax=my_ax,
transform = dem.transform,
cmap = 'viridis',
)
# draw dem as contours
rio_show(
dem_data,
ax=my_ax,
contour=True,
transform = dem.transform,
colors = ['white'],
linewidths = [0.5],
)
# add viewshed
rio_show(
output,
ax=my_ax,
transform=dem.transform,
cmap = LinearSegmentedColormap.from_list('binary_viewshed', [(0, 0, 0, 0), (1, 0, 0, 0.5)], N=2)
)
# add origin point
GeoSeries(Point(x0, y0)).plot(
ax = my_ax,
markersize = 60,
color = 'black',
edgecolor = 'white'
)
# add a colour bar
fig.colorbar(ScalarMappable(norm=Normalize(vmin=floor(dem_data.min()), vmax=ceil(dem_data.max())), cmap='viridis'), ax=my_ax, pad=0.01)
# add north arrow
x, y, arrow_length = 0.97, 0.99, 0.1
my_ax.annotate('N', xy=(x, y), xytext=(x, y-arrow_length),
arrowprops=dict(facecolor='black', width=5, headwidth=15),
ha='center', va='center', fontsize=20, xycoords=my_ax.transAxes)
# add scalebar
my_ax.add_artist(ScaleBar(dx=1, units="m", location="lower right"))
# add legend for point
my_ax.legend(
handles=[
Patch(facecolor=(1, 0, 0, 0.5), edgecolor=None, label=f'Visible Area'),
Line2D([0], [0], marker='o', color=(1,1,1,0), label='Viewshed Origin', markerfacecolor='black', markersize=8)
], loc='lower left')
# save the result
savefig('./out/7.png', bbox_inches='tight')
print("done!")