"""
Understanding GIS: Practical 6
@author jonnyhuck
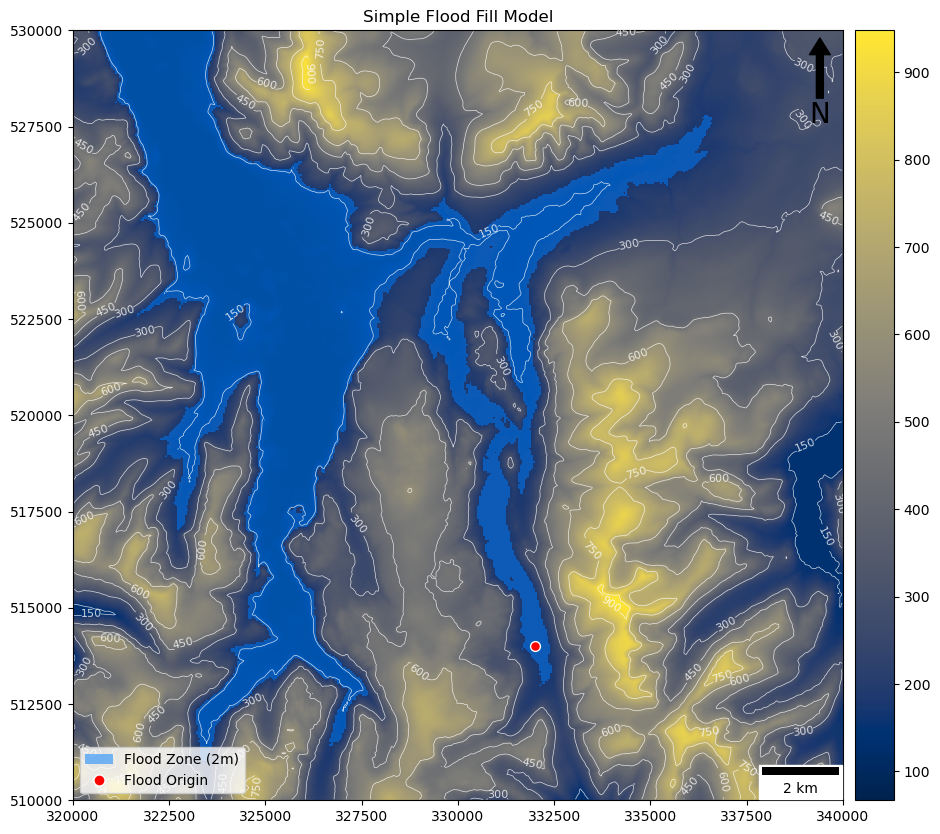
Simple implementation of a flood fill model
References:
https://rasterio.readthedocs.io/en/latest/
https://docs.python.org/3/tutorial/errors.html
https://rasterio.readthedocs.io/en/latest/quickstart.html
https://rasterio.readthedocs.io/en/stable/topics/plotting.html
https://rasterio.readthedocs.io/en/latest/api/rasterio.plot.html
https://matplotlib.org/stable/gallery/color/colormap_reference.html
https://matplotlib.org/api/_as_gen/matplotlib.axes.Axes.contour.html#matplotlib.axes.Axes.contour
Note:
You *cannot* use a try-except statement to catch an Index Error, as negative numbers are valid
and so just wrap around to the other side of the dataset
New Topics:
Rasters
Sets
numpy arrays
with statements
continue statements
"""
from numpy import zeros
from math import floor, ceil
from geopandas import GeoSeries
from shapely.geometry import Point
from matplotlib.lines import Line2D
from matplotlib.patches import Patch
from rasterio import open as rio_open
from matplotlib.colors import Normalize
from matplotlib.cm import ScalarMappable
from rasterio.plot import show as rio_show
from matplotlib.pyplot import subplots, savefig
from matplotlib_scalebar.scalebar import ScaleBar
from matplotlib.colors import LinearSegmentedColormap
def flood_fill(depth, x0, y0, d, dem_data):
"""
Calculate flooding extent from a point location
"""
# create output array at the same dimensions as the d
flood_layer = zeros(dem_data.shape)
# convert from coordinate space to image space
r0, c0 = d.index(x0, y0)
# set for cells already assessed
assessed = set()
# set for cells to be assessed
to_assess = set()
# start with the origin cell
to_assess.add((r0, c0))
# calculate the maximum elevation of the flood
flood_extent = dem_data[(r0, c0)] + depth
# keep looping as long as there are cells left to be checked
while to_assess:
# get the next cell to be assessed (removing it from the to_assess set)
r, c = to_assess.pop()
# add it to the register of those already assessed
assessed.add((r, c))
# is the elevation low enough for this cell to be flooded?
if dem_data[(r, c)] <= flood_extent:
# mark the current cell as flooded
flood_layer[(r, c)] = 1
# loop through all neighbouring cells
for r_adj, c_adj in [(-1, -1), (-1, 0), (-1, 1), (0, -1), (0, 1), (1, -1), (1, 0), (1, 1)]:
# get current neighbour
neighbour = (r + r_adj, c + c_adj)
# make sure that the location is wihin the bounds of the dataset and has not been assessed previously...
if 0 <= neighbour[0] < dem.height and 0 <= neighbour[1] < dem.width and neighbour not in assessed:
# ...then add to the set for assessment
to_assess.add(neighbour)
# when complete, return the result
return flood_layer
# set the depth of the flood
FLOOD_DEPTH = 2
# set origin for the flood as a tuple
LOCATION = (332000, 514000)
# open the raster dataset
with rio_open("../../data/helvellyn/Helvellyn-50.tif") as dem: # 50m resolution
# read the data out of band 1 in the dataset
dem_data = dem.read(1)
# calculate the flood
output = flood_fill(FLOOD_DEPTH, LOCATION[0], LOCATION[1], dem, dem_data)
# output image
fig, my_ax = subplots(1, 1, figsize=(16, 10))
my_ax.set_title("Simple Flood Fill Model")
# draw dem
rio_show(
dem_data,
ax=my_ax,
transform = dem.transform,
cmap = 'cividis',
)
# draw dem as contours
rio_show(
dem_data,
ax=my_ax,
contour=True,
transform = dem.transform,
colors = ['white'],
linewidths = [0.5],
)
# add flooding
rio_show(
output,
ax=my_ax,
transform=dem.transform,
cmap = LinearSegmentedColormap.from_list('binary', [(0, 0, 0, 0), (0, 0.5, 1, 0.5)], N=2)
)
# add origin point
GeoSeries(Point(LOCATION)).plot(
ax = my_ax,
markersize = 50,
color = 'red',
edgecolor = 'white'
)
# add a colour bar
fig.colorbar(ScalarMappable(norm=Normalize(vmin=floor(dem_data.min()), vmax=ceil(dem_data.max())), cmap='cividis'), ax=my_ax, pad=0.01)
# add north arrow
x, y, arrow_length = 0.97, 0.99, 0.1
my_ax.annotate('N', xy=(x, y), xytext=(x, y-arrow_length),
arrowprops=dict(facecolor='black', width=5, headwidth=15),
ha='center', va='center', fontsize=20, xycoords=my_ax.transAxes)
# add scalebar
my_ax.add_artist(ScaleBar(dx=1, units="m", location="lower right"))
# add legend for point
my_ax.legend(
handles=[
Patch(facecolor=(0, 0.5, 1, 0.5), edgecolor=None, label=f'Flood Zone ({FLOOD_DEPTH}m)'),
Line2D([0], [0], marker='o', color=(1,1,1,0), label='Flood Origin', markerfacecolor='red', markersize=8)
], loc='lower left')
# save the result
savefig('./out/7.png', bbox_inches='tight')
print("done!")