Jump to “A Little Bit More…” Solution
"""
Understanding GIS: Practical 4
@author jonnyhuck
Visvalingam-Whyatt Line Simplification
References:
Visvalingam & Whyatt (1993): https://www.tandfonline.com/doi/pdf/10.1179/000870493786962263
Visvalingam (2016): https://www.tandfonline.com/doi/pdf/10.1080/00087041.2016.1151097
Mandelbrot (1983): https://science.sciencemag.org/content/sci/156/3775/636.full.pdf
https://bost.ocks.org/mike/simplify/
https://mapshaper.org/
https://matplotlib.org/stable/gallery/text_labels_and_annotations/custom_legends.html
https://cartographicperspectives.org/index.php/journal/article/view/cp68-roth-et-al/html
https://docs.python.org/3/tutorial/datastructures.html
https://docs.python.org/3/library/copy.html
New Topics:
List Comprehension
if Statements
Shallow copies
Dictionaries
Shapely Geometry Types
"""
from sys import exit
from math import sqrt
from shapely.geometry import LineString
from geopandas import read_file, GeoSeries
from matplotlib_scalebar.scalebar import ScaleBar
from matplotlib.pyplot import subplots, savefig, subplots_adjust
def distance(x1, y1, x2, y2):
"""
* Use Pythagoras' theorem to measure a distance.
* https://en.wikipedia.org/wiki/Pythagorean_theorem
"""
return sqrt((x1 - x2)**2 + (y1 - y2)**2)
def get_effective_area(a, b, c):
"""
* Calculate the area of a triangle made from the points a, b and c using Heron's formula
* https://en.wikipedia.org/wiki/Heron%27s_formula
*
* Could be simplified to:
* `abs( (a[0]-c[0]) * (b[1]-a[1]) - (a[0]-b[0]) * (c[1]-a[1]) ) * 0.5`
"""
# calculate the length of each side
side_a = distance(b[0], b[1], c[0], c[1])
side_b = distance(a[0], a[1], c[0], c[1])
side_c = distance(a[0], a[1], b[0], b[1])
# calculate semi-perimeter of the triangle (perimeter / 2)
s = (side_a + side_b + side_c) / 2
# apply Heron's formula and return
return sqrt(s * (s - side_a) * (s - side_b) * (s - side_c))
def visvalingam_whyatt(node_list, n_nodes):
"""
* Simplify a line using point elimination based on effective area
"""
# calculate and store the effective area for each point, excluding the end points
areas = [ {"point": node_list[i], "area": get_effective_area(node_list[i-1],
node_list[i], node_list[i+1])} for i in range(1, len(node_list)-1) ]
# add the end points back in (in this case they are the same as our line is a polygon)
areas.insert(0, {"point": node_list[0], "area": 0})
areas.insert(len(areas), {"point": node_list[len(node_list)-1], "area": 0})
# take a shallow copy of the list so that we don't edit the original
nodes = areas.copy()
# keep going until we run out of nodes
while len(nodes) > n_nodes:
# init min area with a large number
min_area = float("inf")
# loop through every point, excluding the end points
for i in range(1, len(nodes)-1):
# if the effective area of this point is smaller than the previous minimum
if nodes[i]['area'] < min_area:
# store the mew minimum area and the index of the point
min_area = nodes[i]['area']
node_to_delete = i
# remove the current point from the list
nodes.pop(node_to_delete)
# recalculate effective area to the left of the deleted node
nodes[node_to_delete-1]['area'] = get_effective_area(nodes[node_to_delete-2]['point'],
nodes[node_to_delete-1]['point'], nodes[node_to_delete]['point']) # left
# if there is a node to the right of the deleted node, recalculate the effective area
if node_to_delete < len(nodes)-1:
nodes[node_to_delete]['area'] = get_effective_area(nodes[node_to_delete-1]['point'],
nodes[node_to_delete]['point'], nodes[node_to_delete+1]['point']) # right
# extract the nodes and return
return [ node['point'] for node in nodes ]
# set the percentage of nodes that you want to remove
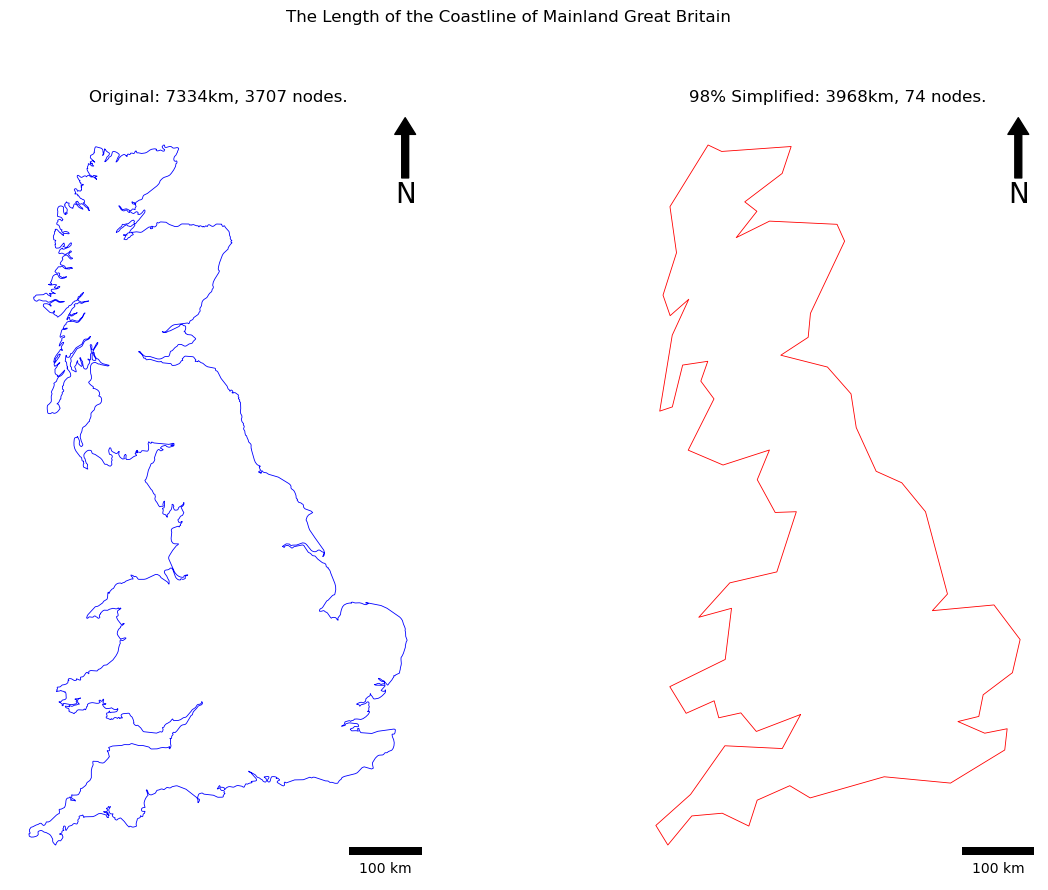
SIMPLIFICATION_PERC = 98
# get the proj string definition for British National Grid (OSGB)
osgb = "+proj=tmerc +lat_0=49 +lon_0=-2 +k=0.9996012717 +x_0=400000 +y_0=-100000 +ellps=airy +towgs84=446.448,-125.157,542.06,0.15,0.247,0.842,-20.489 +units=m +no_defs"
# open a dataset of all contries in the world
world = read_file("../../data/natural-earth/ne_10m_admin_0_countries.shp")
# extract the UK, project, and extract the geometry (a multipolygon)
uk = world[(world.ISO_A3 == 'GBR')].to_crs(osgb).geometry.iloc[0]
# loop through the multipolygon and find the biggest bit (mainland Great Britain)
if uk.geom_type != 'MultiPolygon':
print("Data is not a MultiPolygon, exiting...")
exit()
coord_list = []
biggest_area = 0
for poly in uk.geoms:
# if it is the biggest so far, update biggest area store the coordinates
if poly.area > biggest_area:
biggest_area = poly.area
coord_list = list(poly.boundary.coords)
# make a linestring out of the coordinates
before_line = LineString(coord_list)
print(f"original node count: {len(coord_list)}")
print(f"original length: {before_line.length / 1000:.2f}km\n") # add newline (\n) to the end of this one
# how many nodes do we need?
n_nodes = int(len(coord_list) / 100.0 * (100 - SIMPLIFICATION_PERC))
# ensure that there are at least 3 nodes (minimum for a polygon)
if n_nodes < 3:
n_nodes = 3
# remove one node and overwrite it with the new, shorter list
simplified_nodes = visvalingam_whyatt(coord_list, n_nodes)
# make the resulting list of coordinates into a line
after_line = LineString(simplified_nodes)
print(f"simplified node count: {len(simplified_nodes)}")
print(f"simplified length: {after_line.length / 1000:.2f}km")
print() # print blank line
# create map axis object, with two axes (maps)
fig, my_axs = subplots(1, 2, figsize=(16, 10))
# set titles
fig.suptitle("The Length of the Coastline of Mainland Great Britain")
my_axs[0].set_title(f"Original: {before_line.length / 1000:.0f}km, {len(coord_list)} nodes.")
my_axs[1].set_title(f"{SIMPLIFICATION_PERC}% Simplified: {after_line.length / 1000:.0f}km, {len(simplified_nodes)} nodes.")
# reduce the gap between the subplots
subplots_adjust(wspace=0)
# add the original coastline
GeoSeries(before_line, crs=osgb).plot(
ax=my_axs[0],
color='blue',
linewidth = 0.6,
)
# add the new coastline
GeoSeries(after_line, crs=osgb).plot(
ax=my_axs[1],
color='red',
linewidth = 0.6,
)
# edit individual axis
for my_ax in my_axs:
# remove axes
my_ax.axis('off')
# add north arrow
x, y, arrow_length = 0.95, 0.99, 0.1
my_ax.annotate('N', xy=(x, y), xytext=(x, y-arrow_length),
arrowprops=dict(facecolor='black', width=5, headwidth=15),
ha='center', va='center', fontsize=20, xycoords=my_ax.transAxes)
# add scalebar
my_ax.add_artist(ScaleBar(dx=1, units="m", location="lower right"))
# save the result
savefig(f'out/4.png', bbox_inches='tight')
print("done!")
A Little Bit More…
"""
Understanding GIS: Practical 4 (A Little Bit Extra... Task 2)
@author jonnyhuck
Visvalingam-Whyatt Line Simplification of multiple shapes
References:
Visvalingam & Whyatt (1993): https://www.tandfonline.com/doi/pdf/10.1179/000870493786962263
Visvalingam (2016): https://www.tandfonline.com/doi/pdf/10.1080/00087041.2016.1151097
Mandelbrot (1983): https://science.sciencemag.org/content/sci/156/3775/636.full.pdf
https://bost.ocks.org/mike/simplify/
https://mapshaper.org/
https://matplotlib.org/stable/gallery/text_labels_and_annotations/custom_legends.html
https://cartographicperspectives.org/index.php/journal/article/view/cp68-roth-et-al/html
https://docs.python.org/3/tutorial/datastructures.html
https://docs.python.org/3/library/copy.html
New Topics:
List Comprehension
if Statements
Shallow copies
Dictionaries
Shapely Geometry Types
"""
from sys import exit
from math import sqrt
from shapely.geometry import LineString
from geopandas import read_file, GeoSeries
from matplotlib_scalebar.scalebar import ScaleBar
from matplotlib.pyplot import subplots, savefig, subplots_adjust
def distance(x1, y1, x2, y2):
"""
* Use Pythagoras' theorem to measure a distance.
* https://en.wikipedia.org/wiki/Pythagorean_theorem
"""
return sqrt((x1 - x2)**2 + (y1 - y2)**2)
def get_effective_area(a, b, c):
"""
* Calculate the area of a triangle made from the points a, b and c using Heron's formula
* https://en.wikipedia.org/wiki/Heron%27s_formula
*
* Could be simplified to:
* `abs( (a[0]-c[0]) * (b[1]-a[1]) - (a[0]-b[0]) * (c[1]-a[1]) ) * 0.5`
"""
# calculate the length of each side
side_a = distance(b[0], b[1], c[0], c[1])
side_b = distance(a[0], a[1], c[0], c[1])
side_c = distance(a[0], a[1], b[0], b[1])
# calculate semi-perimeter of the triangle (perimeter / 2)
s = (side_a + side_b + side_c) / 2
# apply Heron's formula and return
return sqrt(s * (s - side_a) * (s - side_b) * (s - side_c))
def visvalingam_whyatt(node_list, n_nodes):
"""
* Simplify a line using point elimination based on effective area
"""
# calculate and store the effective area for each point, excluding the end points
areas = [ {"point": node_list[i], "area": get_effective_area(node_list[i-1],
node_list[i], node_list[i+1])} for i in range(1, len(node_list)-1) ]
# add the end points back in (in this case they are the same as our line is a polygon)
areas.insert(0, {"point": node_list[0], "area": 0})
areas.insert(len(areas), {"point": node_list[len(node_list)-1], "area": 0})
# take a shallow copy of the list so that we don't edit the original
nodes = areas.copy()
# keep going until we run out of nodes
while len(nodes) > n_nodes:
# init min area with a large number
min_area = float("inf")
# loop through every point, excluding the end points
for i in range(1, len(nodes)-1):
# if the effective area of this point is smaller than the previous minimum
if nodes[i]['area'] < min_area:
# store the mew minimum area and the index of the point
min_area = nodes[i]['area']
node_to_delete = i
# remove the current point from the list
nodes.pop(node_to_delete)
# recalculate effective area to the left of the deleted node
nodes[node_to_delete-1]['area'] = get_effective_area(nodes[node_to_delete-2]['point'],
nodes[node_to_delete-1]['point'], nodes[node_to_delete]['point']) # left
# if there is a node to the right of the deleted node, recalculate the effective area
if node_to_delete < len(nodes)-1:
nodes[node_to_delete]['area'] = get_effective_area(nodes[node_to_delete-1]['point'],
nodes[node_to_delete]['point'], nodes[node_to_delete+1]['point']) # right
# extract the nodes and return
return [ node['point'] for node in nodes ]
# set the percentage of nodes that you want to remove
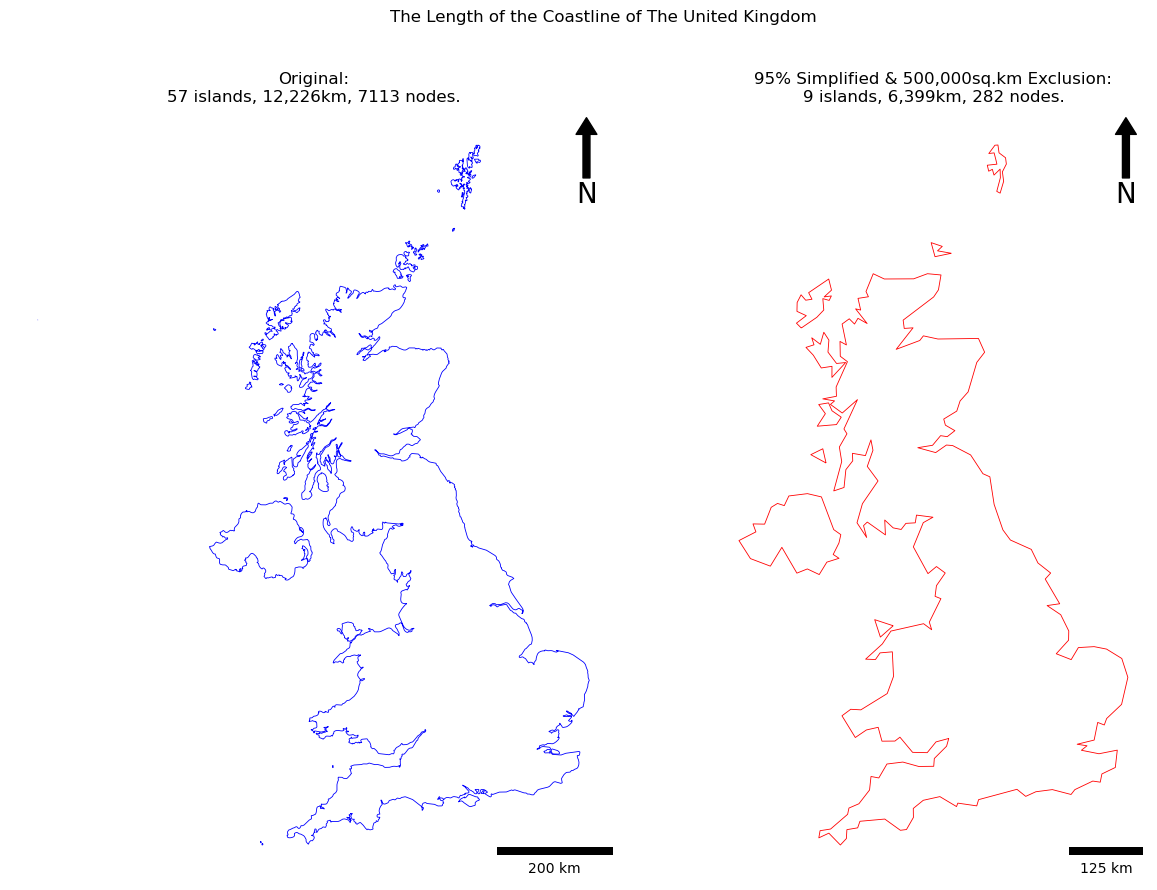
SIMPLIFICATION_PERC = 95
EXCLUSION_AREA = 500000000
# get the proj string definition for British National Grid (OSGB)
osgb = "+proj=tmerc +lat_0=49 +lon_0=-2 +k=0.9996012717 +x_0=400000 +y_0=-100000 +ellps=airy +towgs84=446.448,-125.157,542.06,0.15,0.247,0.842,-20.489 +units=m +no_defs"
# open a dataset of all contries in the world
world = read_file("../data/natural-earth/ne_10m_admin_0_countries.shp")
# extract the UK, project, and extract the geometry (a multipolygon)
uk = world[(world.ISO_A3 == 'GBR')].to_crs(osgb).geometry.iloc[0]
# loop through the multipolygon and find the biggest bit (mainland Great Britain)
if uk.geom_type != 'MultiPolygon':
print("Data is not a MultiPolygon, exiting...")
exit()
# init counter variables
original_nodes = 0
original_len = 0
original_islands = 0
simplified_nodes = 0
simplified_len = 0
simplified_islands = 0
# init lists to hold the results
original_lines = []
simplified_lines = []
# loop through each polygon in the multipolygon
for poly in uk.geoms:
''' this is done outside of the if statement to account for nodes lost in elimination '''
# extract coordinates for the current polygon
coord_list = list(poly.boundary.coords)
# make a linestring out of the coordinates & update counters
before_line = LineString(coord_list)
original_lines.append(before_line)
# update counters
original_nodes += len(coord_list)
original_len += before_line.length / 1000
original_islands += 1
# eliminate polygons that are too small
if poly.area > EXCLUSION_AREA:
# how many nodes do we need?
n_nodes = int(len(coord_list) / 100.0 * (100 - SIMPLIFICATION_PERC))
# ensure that there are at least 3 nodes
if n_nodes < 3:
n_nodes = 3
# remove one node and overwrite it with the new, shorter list
simplified_coord_list = visvalingam_whyatt(coord_list, n_nodes)
# make the resulting list of coordinates into a line
after_line = LineString(simplified_coord_list)
simplified_lines.append(after_line)
# update counters
simplified_nodes += len(simplified_coord_list)
simplified_len += after_line.length / 1000
simplified_islands += 1
print(f"original node count: {original_nodes}")
print(f"original length: {original_len:.2f}km\n")
print(f"simplified node count: {simplified_nodes}")
print(f"simplified length: {simplified_len:.2f}km")
# create map axis object, with two axes (maps)
fig, my_axs = subplots(1, 2, figsize=(16, 10))
# set titles
fig.suptitle("The Length of the Coastline of The United Kingdom")
my_axs[0].set_title(f"Original:\n{original_islands} islands, {original_len:,.0f}km, {original_nodes} nodes.")
my_axs[1].set_title(f"{SIMPLIFICATION_PERC}% Simplified & {EXCLUSION_AREA / 1000:,.0f}sq.km Exclusion:\n{simplified_islands} islands, {simplified_len:,.0f}km, {simplified_nodes} nodes.")
# reduce the gap between the subplots
subplots_adjust(wspace=0)
# add the original coastline
GeoSeries(original_lines, crs=osgb).plot(
ax=my_axs[0],
color='blue',
linewidth = 0.6,
)
# add the new coastline
GeoSeries(simplified_lines, crs=osgb).plot(
ax=my_axs[1],
color='red',
linewidth = 0.6,
)
# edit individual axis
for my_ax in my_axs:
# remove axes
my_ax.axis('off')
# add north arrow
x, y, arrow_length = 0.95, 0.99, 0.1
my_ax.annotate('N', xy=(x, y), xytext=(x, y-arrow_length),
arrowprops=dict(facecolor='black', width=5, headwidth=15),
ha='center', va='center', fontsize=20, xycoords=my_ax.transAxes)
# add scalebar
my_ax.add_artist(ScaleBar(dx=1, units="m", location="lower right"))
# save the result
savefig(f'out/4-multi.png', bbox_inches='tight')
print("done!")