In which you apply the skills that you have learned so far to start your climb out of the desert of despair!
For your first assessment, I want you to:
Using
data/natural-earth/ne_10m_admin_0_countries.shp, write an algorithm that can calculate the shortest international border in the world as quickly as possible, report the length, and draw me a map of it.
For the purposes of this analysis, we will define an international border as: a shared boundary between two countries that can be crossed from one country to another.
Your code should be accompanied by a report of up to 1,000 words justifying your process and discussing your result.
Make sure that you read this whole document before you start!
Contents
Submission
This work must be submitted by 14:00 on Thursday 13th November 2025 (Week 7).
You must submit your code and a report of up to up to 1,000 words in length describing the choices that you made in order to create an accurate and efficient algorithm. Code snippets can be used in the report where appropriate (not included in the word count) - but remember that I do not just want a line by line description of your code (that is what your comments are for)!
***Note that you must submit your assessment as described here - not having read the below instructions will not be accepted as a reason for late or incorrect submission***
-
The Code part of your submission must be submitted as a link to your Assessment 1 GitHub Repository (see below), stored under your using your
gis-123456789GitHub account. Submit the HTTPS URL to this formThe URL is easily accessed by going to your
ugis-assessment1repository on the GitHub website, clicking the the green Code button and selecting the HTTPS tab. It should look something like this:https://github.com/gis-123456789/ugis-assessment1.git).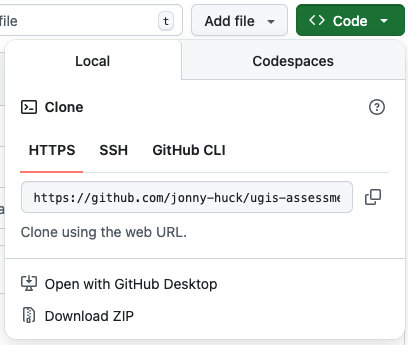
-
The Report part of your submission must be submitted as usual on Canvas. The report should contain the map(s) that you have produced. Submitted files should be named in the format:
123456789.docxor123456789.pdfetc. -
Please check that my user has been successfully added to your GitHub repository (in Collaborators on the website) - if it still says “pending invite” at the time you submit, then please delete the invite and re-send.
-
This step is optional, but following submission, please consider filling out the AI Policy Survey, which is completely anonymous - this will allow us to make sure that it is as effective as possible.
Creating your Assessment 1 Git Repository
Your Assessment 1 Git Repository should be separate to your main understanding gis repository. As before, you will create this using a template that alrady contains the necessary directory structure and datasets. This is just the same process as you did in Week 1:
First, go to this website to get the Assessment 1 template. Click on the green Use this template button in the top tight and select the option for Create a new repository. Name the repository ugis-assessment1, set visibility to Private and click the green Create Repository button. Follow the process until you have your repository.
Next, click on Settings (at the top of the page) → Collaborators and click Add people.
Type jonny-huck into the search bar and select my user “Jonny Huck” (NOTE: you need to add jonny-huck, not jonnyhuck), then click Invite - this will allow me to be able to access the repository for marking purposes.
Finally, clone the repository into your UGIS/ directory using GitHub Desktop.
You are now ready to start coding your assessment! Don’t forget to commit regularly with informative messages and push to your remote repostory (as this is what gets marked).
Marking Criteria
Marks will be given based upon:
- The quality of the solution (code repository) (60%), comprising:
-
Adherence to the AI Policy
-
Evidence of proper use of version control (frequent commits and informative messages, assessed through the
git log). The assessment of your version control then serves as a multiplier (on a scale of 0-1) for:- The presentation and elegance of the code - assessed by reading the code
- Detailed comments, demonstrating a thorough understanding of what you have done - assessed by reading the code
- The result (i.e., does the solution give the expected answer) - assessed by running the code
- The efficiency of the solution (i.e., the speed with which your algorithm resolves the problem) - assessed by running the code
- The robustness of the solution (i.e., the script will not fail if it encounters ’normal’ problems, such as incorrect file paths, missing data, unexpected inputs, and so on) - assessed by running the code
Accordingly - please be sure that you understand that inadequate version control will severely limit the marks available to you!
- The quality of the report (40%), comprising:
- A Justification for any key methodological choices that were made (benefits and limitations) in the design of both the algorithm and the map. This is not a line by line description of your code (your comments do this), but an explanation of why you made key decisions that contributed to the elegance, efficiency or robustness of this algorithm; and the quality of the map.
- A discussion on key Limitations of your analysis, including a clear demonstration of the understanding of the Geographical Information Science involved in these decisions (i.e. what factors affect the measurement of international borders?)
- The cartographic aesthetic quality and legibility of the resulting map(s), and a justification of your chosen CRS - think about how you can go beyond simply reproducing the boundary map from Week 2.
- Space is limited, so you need to prioritise the most important elements that best demonstrate your understanding.
In all of the above, you would expect clear links to the material that we have covered in class - so think carefully! The key to this is in the name of the course: In both your code and report I want you to demonstrate a clear understanding of what you have done (this is why comments are so important in your code)! References are not mandatory, but may be useful to support your demonstration of underdstanding.
Assessment 1 Hints and Tips
This assessment has been designed in order to combine the skills and knowledge that you have learned over the course so far, including:
- Calculating and measuring the length of a border
- Making a spatial analysis as efficient as possible
- Demonstrating an understanding of issues that might affect the veracity of your result
- Producing a Map and selecting an appropriate CRS
From a Python perspective, it will give you an opportunity to utilise skills such as: variables, lists, loops, conditional statements, functions etc.
The intention is that, by having the opportunity to apply your knowledge to a project in this way, you will more fully understand what we have been doing, and be better positioned to move into the second part of the course.
Remember, you have generic examples of all of the major operations that we have covered available in the Hints page, and the solutions for all of the previous practicals are available on the Solutions page. If you get stuck, you can get help via the forum!
Pseudocode
Remember the golden rule: Don’t Panic! You have done almost every part of this assessment in the course already, this is just a matter of finding the right bits and putting them together!
Conceptually, this is not too difficult a question to answer. You just need to think about your algorithm and break it down into small tasks that the computer will be able to understand (all of which you have done before…).
For example you could break it down into something along the lines of the following process (this is not necessarily the best approach, but it is a good start!):
start timer
open countries dataset
loop through each country (country_a):
	loop through each country (country_b):
		if there is a border between country_a and country_b:
			calculate the border (make sure it is valid)
			measure the length of the border
			if the length is the smallest so far so far:
      	store the length, both countries and the border
draw a map of the resulting countries and border
print the result
end timer
Not too complicated, right? All you need to do is keep breaking down each stage into smaller and smaller jobs until you have a clear idea of how the program should look.
Do not be daunted by this assessment, there is nothing here that you haven’t done before! Just take a deep breath and start planning it out like I have taught you. Remember - if something seems too complicated, break it down into increasingly small steps - the smaller the steps, the easier solution!
Testing your submission
Remember that I need to be able to run your code when you submit it - otherwise I can’t mark it! For this reason:
- You must not use any libraries that are not already available within the
understandinggisanaconda environment. - Ensure that your file paths are relative file paths (e.g.
data/ne_10m_admin_0_countries.shp). If you use absolute file paths (e.g.C:/jimbob/understandingis/assessment1/data/ne_10m_admin_0_countries.shp) then your code will not work when I run it!
Code Presentation and AI Use
Presenting neat and tidy code is an important part of Python - one of the key ideas that Guido van Rossum had when creating Python was that code is read much more often than it is written, and so it makes sense to prioritise readability over writability.
Good, tidy, readable code demonstrates that It will demonstrate that you are a competent programmer, and will even help to get you good marks in your assessments! Key elements of well presented code include:
- Follow the Rule of Thirds and make sure that your comments explain exactly what is going on.
- Make sure that variable, function and class names are all descriprive of what they do.
- Use
snake_casefor variable and function names. - Make sure your code is well structured, normally:
importstatements- functions
- main code
- Do not leave in any unnecessary testing material, such as
print()statements that do not contribute to the user experience. - Do not import libraries or functions that you are not using.
- Remember that you MUST adhere to the AI Policy, and you must use proper Version Control throughout your development process, as part of your assessment is your git log. Failing to do either of these things will likely result in a very low mark (see Marking Criteria).
For more guidance on how best to present your code, check out PEP8, the official Style Guide for Python Code.
Error Messages
Remember, when you get an error message in the console, it is not the computer telling you off or making fun of you - it is trying to help you! If you read it carefully it will tell you both what the problem is and even which line of code is causing it - so don’t get upset when you get a lot of errors, find the line of code that is causing the problem, read the description (Paste it into Google if you don’t understand it) and see if you can solve it - you’ll probably find that in most cases you can!
It is also worth remembering that the error message is extremely unlikely to be incorrect; and it is highly unlikely that there is an error in one of the libraries in the understandinggis environment. If, for example, it says it can’t find a file and you are sure that it’s there, then it is likely that either your file path or the working directory (top right hand corner of Spyder) is wrong.
The fact is that programming is is never like writing an essay - the process is generally that you write code and then debug it. This doesn’t change as you get more experienced, the errors just get more complicated!!
Additional Pointers
- Don’t put it off, the longer you give yourself to complete this, the easier you will make it for yourself. Remember that this assignment is about consolidation of your knowledge from the course so far - you should expect to find it challenging, but remember that there is nothing in this assessment that you haven’t done already as part of the practicals in weeks 1-5.
- Read these instructions carefully and in theor entirety - particularly around submission - you must submit both your GitHub URL and Report for the submission to count.
- Don’t underestimate the importance of proper version control - a poor Git log could mean that you can only access a maximum score of 40%.
- Don’t try to use AI to do it for you - you won’t learn anything, and will likely get a very poor mark.
- Pay attention to the TYPE (
.geom_type) of geometry that you extract from countries. - When you come to deciding on topological tests and operations, take the time to experiment and think about how you can minimise the amount of work the script is doing (remember more efficient = more marks!)
- Look back to the lectures and practical material, and make use of the Hints and Solutions pages.
- When deciding on a CRS, you might also find this
geopandasfunction worth investigating (though it is not mandatory). In any case, the justification of your choice is the most important thing! - Don’t overlook the cartography - it is worth putting some effort into the map to show me that you can use and understand the plotting functions.
- When explaining what you are doing - remember that I am interested in your solution and justification (i.e., what you are doing and why) than your implementation (i.e., which library or function you used) - remember that your report is intended to demonstrate a thorough understanding of the Geographical Information Science.
- If you do feel like you are starting to panic - talk to me!
Good Luck!!