Jump to “A Little Bit More…” Solution
"""
Understanding GIS: Practical 1
@author jonnyhuck
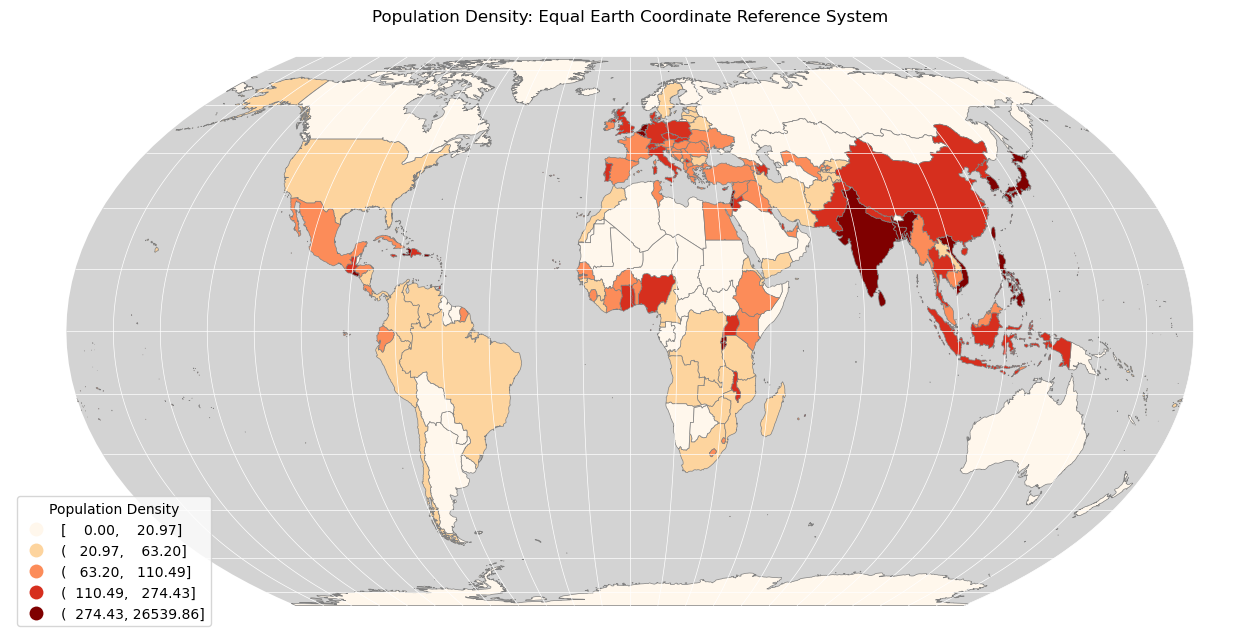
Population Density World Map
References:
http://geopandas.org/mapping.html
http://geopandas.org/reference.html
https://geopandas.readthedocs.io/en/latest/projections.html
https://matplotlib.org/3.1.0/api/_as_gen/matplotlib.pyplot.plot.html
https://www.earthdatascience.org/courses/earth-analytics-python/spatial-data-vector-shapefiles/intro-to-coordinate-reference-systems-python/
New Topics:
Variables
Comments
Calling Functions
GeoPandas
"""
# import libraries
from geopandas import read_file
from matplotlib.pyplot import subplots, savefig
# open the graticule and bounding box
world = read_file("../data/natural-earth/ne_50m_admin_0_countries.shp")
graticule = read_file("../data/natural-earth/ne_110m_graticules_15.shp")
bbox = read_file("../data/natural-earth/ne_110m_wgs84_bounding_box.shp")
# reproject all three layers to equal earth
ea_proj = '+proj=eqearth +lon_0=0 +datum=WGS84 +units=m +no_defs'
world = world.to_crs(ea_proj)
graticule = graticule.to_crs(ea_proj)
bbox = bbox.to_crs(ea_proj)
# calculate the population density
world['pop_density'] = world.POP_EST / (world.area / 1000000)
# create map axis object
my_fig, my_ax = subplots(1, 1, figsize=(15, 8))
# remove axes
my_ax.axis('off')
# add title
my_ax.set_title("Population Density: Equal Earth Coordinate Reference System")
# add bounding box and graticule layers
bbox.plot(
ax = my_ax,
color = 'lightgray',
linewidth = 0,
)
# plot the countries
world.plot(
ax = my_ax,
column = 'pop_density',
linewidth = 0.5,
edgecolor = 'gray',
cmap = 'OrRd',
scheme = 'quantiles',
legend = 'True',
legend_kwds = {
'loc': 'lower left',
'title': 'Population Density'
}
)
# plot the graticule
graticule.plot(
ax = my_ax,
color='white',
linewidth = 0.5,
)
# save the result
savefig('out/1.pop_den.png', bbox_inches='tight')
print("done!")
A little bit more…
"""
Understanding GIS: Practical 1 (A little more...)
@author jonnyhuck
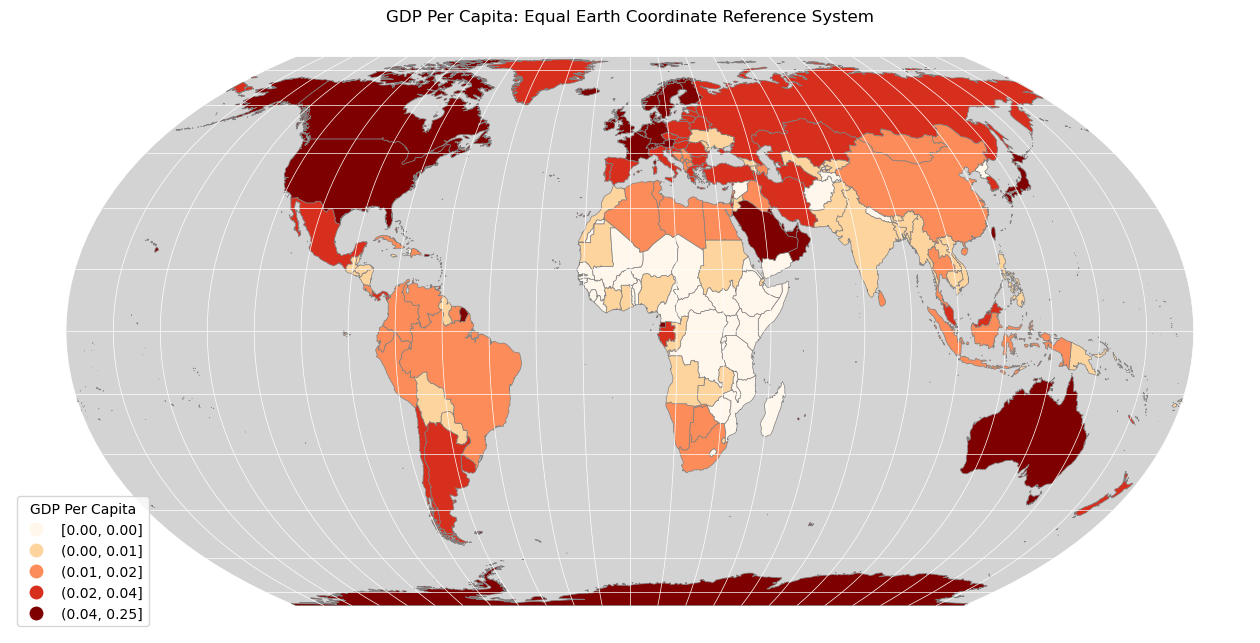
GDP Per Capita World Map
References:
http://geopandas.org/mapping.html
http://geopandas.org/reference.html
https://geopandas.readthedocs.io/en/latest/projections.html
https://matplotlib.org/3.1.0/api/_as_gen/matplotlib.pyplot.plot.html
https://www.earthdatascience.org/courses/earth-analytics-python/spatial-data-vector-shapefiles/intro-to-coordinate-reference-systems-python/
New Topics:
Variables
Comments
Calling Functions
GeoPandas
"""
# import libraries
from geopandas import read_file
from matplotlib.pyplot import subplots, savefig
# open the graticule and bounding box
world = read_file("../data/natural-earth/ne_50m_admin_0_countries.shp")
graticule = read_file("../data/natural-earth/ne_110m_graticules_15.shp")
bbox = read_file("../data/natural-earth/ne_110m_wgs84_bounding_box.shp")
# reproject all three layers to equal earth
ea_proj = '+proj=eqearth +lon_0=0 +datum=WGS84 +units=m +no_defs'
world = world.to_crs(ea_proj)
graticule = graticule.to_crs(ea_proj)
bbox = bbox.to_crs(ea_proj)
# calculate GDP per capita
world['gdp_per_cap'] = world.GDP_MD_EST / world.POP_EST
# create map axis object
my_fig, my_ax = subplots(1, 1, figsize=(16, 10))
# remove axes
my_ax.axis('off')
# add title
my_ax.set_title("GDP Per Capita: Equal Earth Coordinate Reference System")
# add bounding box and graticule layers
bbox.plot(
ax = my_ax,
color = 'lightgray',
linewidth = 0,
)
# plot the countries
world.plot(
ax = my_ax,
column = 'gdp_per_cap',
linewidth = 0.5,
edgecolor = 'gray',
cmap = 'OrRd',
scheme = 'quantiles',
legend = 'True',
legend_kwds = {
'loc': 'lower left',
'title': 'GDP Per Capita'
}
)
# plot the graticule
graticule.plot(
ax = my_ax,
color='white',
linewidth = 0.5,
)
# save the result
savefig('out/1.gdp_pc.png', bbox_inches='tight')
print("done!")