"""
Understanding GIS: Practical 5
@author jonnyhuck
Calculate the distortion on a projected map
References:
Canters et al. (2005): http://citeseerx.ist.psu.edu/viewdoc/download?doi=10.1.1.557.5040&rep=rep1&type=pdf
Gosling & Symeonakis (2020): https://www.tandfonline.com/doi/pdf/10.1080/15230406.2020.1717379
Huck (2025): https://www.tandfonline.com/doi/full/10.1080/00087041.2024.2436324
https://pyproj4.github.io/pyproj/stable/examples.html
https://pyproj4.github.io/pyproj/stable/api/crs/crs.html
https://pyproj4.github.io/pyproj/stable/api/transformer.html
https://pyproj4.github.io/pyproj/stable/api/geod.html
New Topics:
Translating Equations & Text into code
Main Function
Random number generation
Default arguments
Return multiple values
zip and enumerate
//
Multiple Axes / Multi dimensional arrays
list slicing
"""
from numpy import arange
from geopandas import read_file
from numpy.random import uniform
from shapely.geometry import Polygon
from matplotlib.patches import Patch
from math import hypot, sin, cos, radians
from pyproj import Geod, CRS, Transformer
from matplotlib.pyplot import subplots, savefig
from matplotlib_scalebar.scalebar import ScaleBar
def make_bounds_square(ax):
"""
* Adjust the bounds of the specified axis to make them for to a square
"""
# get the current bounds
ax_bounds_x = ax.get_xlim()
ax_bounds_y = ax.get_ylim()
# get the width and height
ax_width = ax_bounds_x[1] - ax_bounds_x[0]
ax_height = ax_bounds_y[1] - ax_bounds_y[0]
# if width is larger, expand height to match
if ax_width > ax_height:
buffer = (ax_width - ax_height) / 2
my_axs[axx][axy].set_ylim((ax_bounds_y[0] - buffer, ax_bounds_y[1] + buffer))
# if height is larger expand width to match
elif ax_width < ax_height:
buffer = (ax_height - ax_width) / 2
my_axs[axx][axy].set_xlim((ax_bounds_x[0] - buffer, ax_bounds_x[1] + buffer))
def compute_offset(origin, distance, direction):
"""
* Offset a location by a given distance and direction
"""
x2 = origin[0] + cos(radians(direction)) * distance
y2 = origin[1] + sin(radians(direction)) * distance
return (x2, y2)
def alternative_areal_distortion(minx, miny, maxx, maxy, minr, maxr, sample_number=1000, vertices=16):
"""
* This is the alternative method presented by Gosling & Symeonakis (2020), and is suggested
* in the "A little bit more" section of the practical
"""
# calculate the required number of random locations (x and y separately) plus radius
xs = uniform(low=minx, high=maxx, size=sample_number)
ys = uniform(low=miny, high=maxy, size=sample_number)
rs = uniform(low=minr, high=maxr, size=sample_number)
# offset distances
forward_azimuths = arange(0, 360, 22.5)
# loop through the points
area_indices = []
for x, y, r in zip(xs, ys, rs):
# construct a circle around the centre point on the ellipsoid
lons, lats = g.fwd([x]*vertices, [y]*vertices, forward_azimuths, [r]*vertices)[:2]
# get the area of the resulting circle
ellipsoidal_circle = Polygon([ transformer.transform(lon, lat, direction='FORWARD') for lon, lat in zip(lons, lats) ])
# transform the centre point to the projected CRS
centre_x, centre_y = transformer.transform(x, y, direction='FORWARD')
# construct a circle around the projected point on a plane, calculate area
planar_circle = Polygon([ compute_offset((centre_x, centre_y), r, az) for az in forward_azimuths ])
# calculate IoU (area of the intersection divided by area of the union)
area_indices.append(1 - ellipsoidal_circle.intersection(planar_circle).area / ellipsoidal_circle.union(planar_circle).area)
# return the mean of the indices
return 1 / sample_number * sum(area_indices)
def evaluate_distortion(g, transformer, minx, miny, maxx, maxy, minr, maxr, sample_number, vertices=16):
"""
* Calculate a selection of distortion measures, see Huck (2025)
"""
''' FINITE AREAL AND SHAPE DISTORTION '''
# calculate the required number of random locations (x and y separately) plus radius
xs = uniform(low=minx, high=maxx, size=sample_number)
ys = uniform(low=miny, high=maxy, size=sample_number)
rs = uniform(low=minr, high=maxr, size=sample_number)
# offset distances
forward_azimuths = arange(0, 360, 22.5)
# loop through the points
area_indices = []
shape_indices = []
distance_indices = []
for x, y, r in zip(xs, ys, rs):
# construct a circle around the centre point on the ellipsoid
lons, lats = g.fwd([x]*vertices, [y]*vertices, forward_azimuths, [r]*vertices)[:2]
# project the result, calculate area, append to the list
e_coords = [ transformer.transform(lon, lat, direction='FORWARD') for lon, lat in zip(lons, lats) ]
# get the area of the resulting circle
ellipsoidal_area = Polygon(e_coords).area
# transform the centre point to the projected CRS
centre_x, centre_y = transformer.transform(x, y, direction='FORWARD')
# construct a circle around the projected point on a plane, calculate area
planar_area = Polygon([ compute_offset((centre_x, centre_y), r, az) for az in forward_azimuths ]).area
# get area index
area_indices.append(abs(ellipsoidal_area - planar_area) / abs(ellipsoidal_area + planar_area))
# get radial distances frpm the centre to each of the 16 points on the circle
ellipsoidal_radial_distances = [ hypot(centre_x - ex, centre_y - ey) for ex, ey in e_coords ]
# get the absolute proportional difference between the expected and actual radial distance for each 'spoke'
shape_distortion = [abs((1 / vertices) - (d / sum(ellipsoidal_radial_distances))) for d in ellipsoidal_radial_distances]
shape_indices.append(sum(shape_distortion))
# calculate areal & shape distortion
Ea = 1 / sample_number * sum(area_indices)
Es = 1 / sample_number * sum(shape_indices)
''' FINITE DISTANCE DISTORTION '''
# loop once per sample required
for _ in range(sample_number):
# get two random locations (x and y separately)
xs = uniform(low=minx, high=maxx, size=2)
ys = uniform(low=miny, high=maxy, size=2)
# calculate the distance along the ellipsoid
ellipsoidal_distance = g.line_length(xs, ys)
# transform the coordinates
origin = transformer.transform(xs[0], ys[0], direction='FORWARD')
destination = transformer.transform(xs[1], ys[1], direction='FORWARD')
# calculate the planar distance
planar_distance = hypot(origin[0] - destination[0], origin[1] - destination[1])
# calculate distance index
distance_indices.append(abs(ellipsoidal_distance - planar_distance) / abs (ellipsoidal_distance + planar_distance))
# calculate distance distortion
Ep = 1 / sample_number * sum(distance_indices) # as per equation
# calibrate and return all of the measures
return Ep, Es, Ea
# this block will only run if the script is executed directly
if __name__ == "__main__":
# set the geographical proj string and ellipsoid (should be the same)
geo_string = "+proj=longlat +datum=WGS84 +no_defs"
g = Geod(ellps='WGS84')
# create a list of dictionaries for the projected CRS' to evaluate for distortion
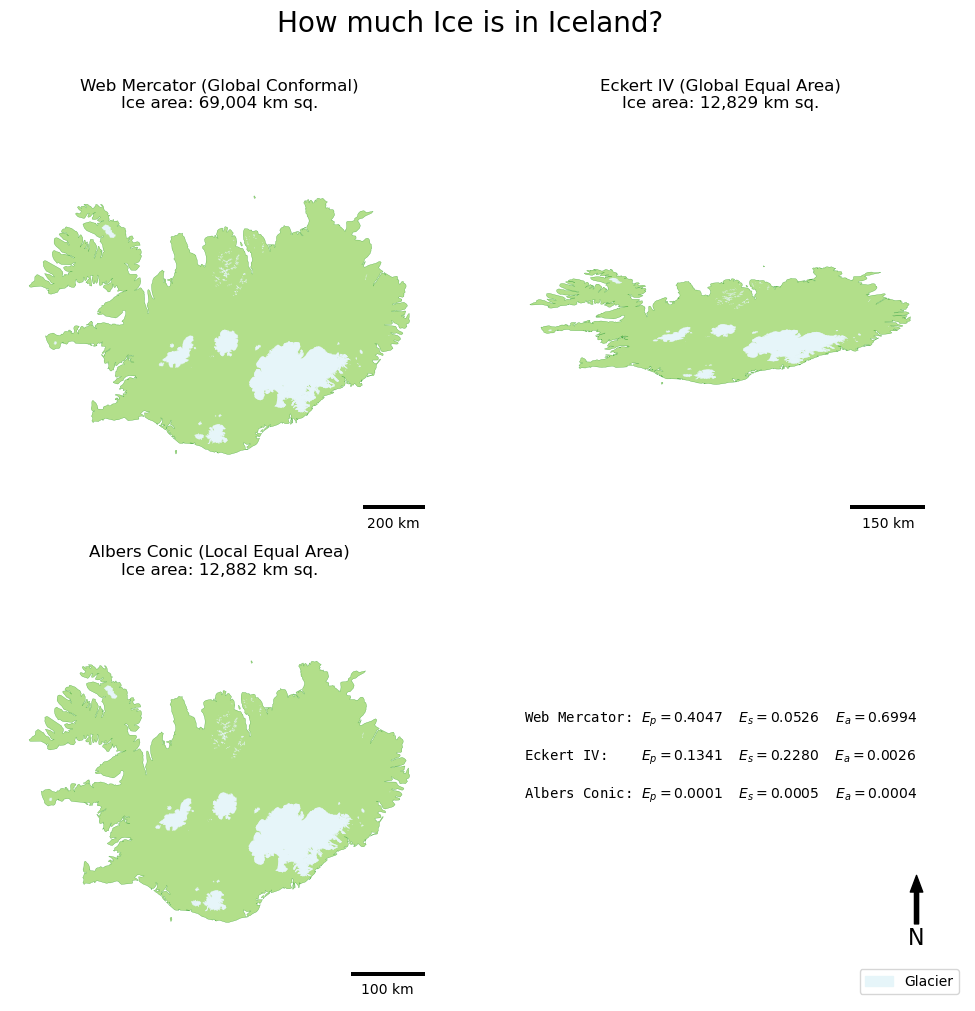
projections = [
{'name':"Web Mercator", 'description':"Global Conformal", 'proj':"+proj=merc +a=6378137 +b=6378137 +lat_ts=0.0 +lon_0=0.0 +x_0=0.0 +y_0=0 +k=1.0 +units=m +nadgrids=@null +wktext +no_defs"},
{'name':"Eckert IV", 'description':"Global Equal Area", 'proj':"+proj=eck4 +lon_0=0 +x_0=0 +y_0=0 +datum=WGS84 +units=m +no_defs"},
{'name':"Albers Conic", 'description':"Local Equal Area", 'proj':"+proj=aea +lon_0=-18.8964844 +lat_1=63.5404797 +lat_2=66.3620426 +lat_0=64.9512612 +datum=WGS84 +units=m +no_defs"}
]
# load the shapefile of countries and extract Iceland
world = read_file("../../data/natural-earth/ne_10m_admin_0_countries.shp")
iceland = world.loc[world.ISO_A3 == "ISL"]
# load the shapefile of land cover and extract the glaciers
land_cover = read_file('../../data/iceland/gis_osm_natural_a_free_1.shp')
ice = land_cover.loc[land_cover.fclass == "glacier"]
# get the bounds of the country
minx, miny, maxx, maxy = iceland.total_bounds
# create a 2x2 figure
fig, my_axs = subplots(2, 2, figsize=(10, 10), constrained_layout=True)
fig.suptitle('How much Ice is in Iceland?\n', fontsize=20)
# loop through each CRS
text = ""
for ax_num, projection in enumerate(projections):
''' CALCULATE DISTORTION '''
# get x and y position of current axis
axx = ax_num // my_axs.shape[0]
axy = ax_num % my_axs.shape[0]
# initialise a PyProj Transformer to transform coordinates
transformer = Transformer.from_crs(CRS.from_proj4(geo_string), CRS.from_proj4(projection['proj']), always_xy=True)
# calculate the distortion
Ep, Es, Ea = evaluate_distortion(g, transformer, minx, miny, maxx, maxy, 10000, 1000000, 1000)
# A LITTLE BIT MORE: calculate alternative areal distortion metric from Gosling & Symeonakis (2020)
gsEa = alternative_areal_distortion(minx, miny, maxx, maxy, 10000, 1000000, sample_number=1000, vertices=16)
# calculate ice area
ice_area_km2 = ice.to_crs(projection['proj']).geometry.area.sum() / 1000000
# report to user
print(f"\n{projection['name']} ({projection['description']})")
print(f"\t{'Distance distortion (Ep):':<26}{Ep:.6f}")
print(f"\t{'Shape distortion (Es):':<26}{Es:.6f}")
print(f"\t{'Area distortion (Ea):':<26}{Ea:.6f}")
print(f"\t{'GS Area distortion (Ea):':<26}{gsEa:.6f}")
print(f"\t{'Ice Area:':<26}{ice_area_km2:,.0f} km sq.")
# append text for figure
text += f"{projection['name']+':':<13} $E_p={Ep:.4f}$ $E_s={Es:.4f}$ $E_a={Ea:.4f}$\n\n"
''' PLOT ON A MAP '''
# disable axis, add title
my_axs[axx][axy].axis('off')
my_axs[axx][axy].set_facecolor('#000000')
my_axs[axx][axy].set_title(f"{projection['name']} ({projection['description']})\nIce area: {ice_area_km2:,.0f} km sq.")
# plot iceland
iceland.to_crs(projection['proj']).plot(
ax = my_axs[axx][axy],
color = "#b2df8a",
edgecolor = '#33a02c',
linewidth = 0.2,
)
# plot ice
ice.to_crs(projection['proj']).plot(
ax = my_axs[axx][axy],
color = "#e6f5f9",
edgecolor = "#e6f5f9",
linewidth = 0.1,
)
# add scalebar
my_axs[axx][axy].add_artist(ScaleBar(dx=1, units="m", location="lower right"))
# adjust the plot bounds to fit a square
make_bounds_square(my_axs[axx][axy])
# disable axis on the empty axis
my_axs[1][1].axis('off')
# manually draw a legend to the empty axis
my_axs[1][1].legend([Patch(facecolor='#e6f5f9', edgecolor='#e6f5f9', label='Glacier')], ['Glacier'], loc='lower right')
# add north arrow to empty axis
x, y, arrow_length = 0.9, 0.3, 0.15
my_axs[1][1].annotate('N', xy=(x, y), xytext=(x, y-arrow_length),
arrowprops=dict(facecolor='black', width=3, headwidth=9),
ha='center', va='center', fontsize=16, xycoords=my_axs[1][1].transAxes)
# add the results to the empty axis - monospace font ensures table alignment
my_axs[1][1].text(0.1, 0.4, text, fontfamily='monospace')
# save the result
savefig('out/5.png', bbox_inches='tight')
print("done!")